Resolution for a Food Secure San Francisco: Using Data and Citywide Coordination to Improve Food Security and Health Outcomes for the City’s Most Vulnerable Residents
San Francisco, California, is a densely populated, high-income city. It has a high cost of living with rates of people experiencing homelessness (many of whom face related food insecurity) among the highest in the nation.1 San Franciscans come from diverse racial and ethnic backgrounds, and the city has a large immigrant population (34.9% of residents are foreign-born).2
San Francisco defines food security as a state in which “all people at all times are able to obtain and consume enough nutritious food to support an active, healthy life.” 3 For San Francisco, there are three elements of food security (adapted from the World Health Organization).4
- Food Resources: “the ability to secure sufficient financial resources to purchase enough nutritious food to support a healthy diet on a consistent basis.” 5 Because of San Francisco’s high cost of living, some residents who would be food secure in many parts of the country lack adequate food resources in San Francisco.
- Food Access: “the ability to obtain affordable, nutritious, and culturally appropriate foods safely and conveniently.” 6 The people with the least access to food include home-bound seniors and adults with disabilities, who sometimes rely on home-delivered meals or groceries for food access. As San Francisco’s senior population grows,7 there will likely be increased demand for food access programs like these.
- Food Consumption: “the ability to prepare healthy meals and the knowledge of basic nutrition, safety, and cooking.” 8 Adequate housing is an important component of food consumption. In San Francisco, thousands of housing units lack complete kitchens, which can be a significant barrier to their residents achieving food security.9
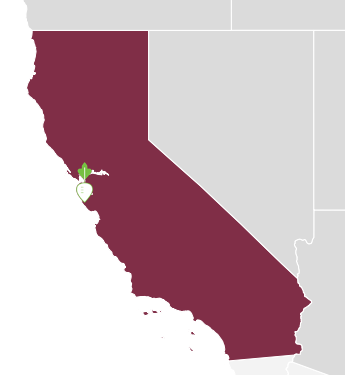
| Key Demographics | |
|---|---|
| Population: 1 | 870,887 |
| Land Area (in sq. mi): | 232 |
| Race/Ethnicity: 2 | 48.5%-White 6.1%-Black or African American 33.3%-Asian 15.1%-Hispanic/Latino (of any race) |
| Population by Age: 2 | 13.4%-under 18 years 73%-18-64 years 13.6%-65 year and older |
| Education: 3 | 87.4%-High school graduate or higher 54.8%-Bachelor’s degree or higher |
| Median Household Income: 3 | $87,701 |
| Population in Poverty: 3 | 12.5% (compared to 15.8% statewide and 15.8% in the U.S. as a whole) |
| Low Income and Low Food Access: 4 | 9.7% of census tracts (19 tracts) |
Although San Francisco has traditionally had many public and community-based organizations working to alleviate hunger and promote good nutrition, the city realized that a coordinated, policy-focused effort was needed to address food security for all San Franciscans.
In 2005 the San Francisco Board of Supervisors, the legislative branch of city/county government in San Francisco, established a Food Security Task Force (FSTF) as an advisory body to the Board. Since that time, the Task Force has been working to understand the magnitude of the problem of food security in San Francisco, as well as the full cadre of government, private, and non-profit resources addressing food security in the city. Members of the Task Force include representatives from fifteen public and community-based organizations in San Francisco including the San Francisco Department of Public Health, the Department of Aging and Adult Services, Meals on Wheels San Francisco, the San Francisco Unified School District, CalFresh, and several others.
Crunching the numbers to assess food insecurity
Timeline of Events
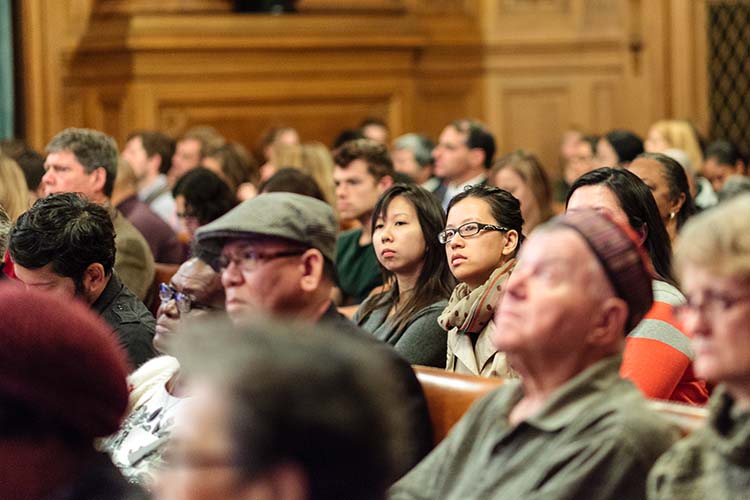
Hearing on Resolution 447-13
Resolution 447-13 was adopted by the Board of Supervisors and went into effect
Board of Supervisors passed their first post-resolution budget, which included increased funding for food security programs (subsequent budgets in 2015, 2016, and 2017 also included new investments based on the 2013 assessment)
By 2010 the Food Security Task Force had decided that they needed to work with better data than what had been available in the past. They decided to conduct an assessment comparing the existing food program coverage citywide with the actual needs of residents in specific areas. It was a major undertaking that took until 2013 to complete. The Task Force focused their inquiry on the people most likely to be food insecure—because of San Francisco’s high cost of living, this included all residents living below 200% of the federal poverty line (28% of San Francisco’s population).10 From that group, the Task Force also broke out as a subset all those living below 100% of the federal poverty line (12% of the population).11 Given that the federal poverty line is used to determine eligibility for certain federal programs, analyzing data on the group below 100% separately helped the Task Force map differences in food insecurity for populations who were and were not eligible for those programs.
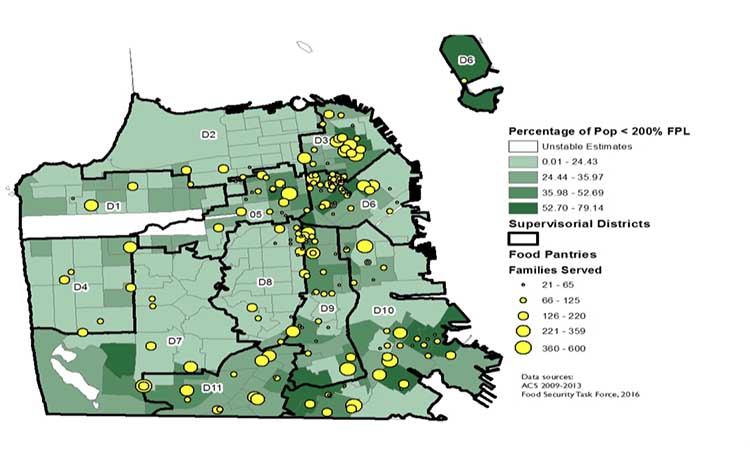
The Task Force broke down the population numbers by supervisorial district and by age. Breakdown by supervisorial district showed unmet food needs in the geographic area of representation for each member of the Board of Supervisors. Because many food security programs target beneficiaries by age (especially those for children and seniors), breaking down the data by age helped show which existing programs food insecure people may be eligible to join. The assessment also mapped the coverage areas of existing food security programs, showing gaps in coverage and opportunities for collaboration between programs with overlapping coverage areas.
Task Force members described the information-gathering process as challenging and time-consuming. “The [2013] assessment was probably the largest effort we had made as a city, as a membership task force, as far as collecting that much data,” said Anne Quaintance, a Task Force member from Meals on Wheels. It was particularly challenging to collect data from people struggling to get their food needs met, a population that can be difficult to reach with standard written surveys. Just acquiring the data for the assessment took a commitment to building relationships within communities.
Although there were a few issues the Task Force expected to find—homelessness was well-known to be a significant problem, especially in a few neighborhoods—mapping the data showed that food insecurity was affecting residents in every neighborhood of the city. Just as importantly, it showed how different residents were falling through the cracks of the city’s existing food security measures. For example:
- CalFresh (California’s SNAP program) was underutilized, with only 50% of eligible residents participating in the program.12
- Home-delivered meal and grocery programs had waitlists.13
- Almost 20,000 housing units lacked complete kitchens for residents to prepare meals.14
The 2013 assessment provided recommendations for improving food resources, access, and consumption throughout the city. It also provided specific recommendations by supervisory district and for vulnerable populations, including seniors and adults with disabilities, children and families, and people experiencing homelessness.
Turning recommendations into a resolution
Years of effort had culminated in the 2013 Assessment of Food Security in San Francisco, a comprehensive guide to unmet food needs in the city. It contained a myriad of recommendations based on the Task Force’s combined research and expertise, but carried no legal weight. Task Force members met with Board of Supervisors member Eric Mar to discuss ways to raise the assessment’s profile and turn its findings into policy action.
Supervisor Mar, his staff, and Task Force members worked together to draft a resolution, which Supervisor Mar sponsored before the Board of Supervisors. As Task Force members remember the process, drafting the resolution was actually not too challenging. Everyone involved in the process had been working together for years, so they had built trust and a shared understanding of their goals. Furthermore, the resolution would call on several public agencies and the Task Force itself to take action and report back to the Board of Supervisors. Drafters wanted to make sure that all those agencies were on the same page before the resolution was passed. Creating the resolution “was a good way, not only to raise awareness, but to bring people together behind the effort,” said Quaintance. The drafters also took extensive public comments, including from service providers and residents from populations at risk for food insecurity, such as the elderly and adults with disabilities.
Resolution 447-13,” 15 Committing to a Food Secure and Hunger Free San Francisco,” was adopted by the Board of Supervisors in December 2013. The resolution committed to ensuring that all San Franciscans would become food secure and hunger free, but it focused several of its specific requirements on marginalized or vulnerable groups. As Paula Jones, a Task Force member from the San Francisco Department of Public Health, put it, “to work on food insecurity is to work with marginalized groups.”
The Task Force resolution drafters looked at existing programs and funding sources, treating them as either policies they needed to leverage or policies they needed to innovate to change. CalFresh was a priority program in the resolution because the program was so underutilized—leveraging CalFresh represented a big opportunity for improvement in nutrition and health outcomes. Recognizing that housing is closely connected to food security, the resolution required follow-up action to determine strategies and costs for improving food security among under-housed populations. These included people experiencing homelessness and also residents of single-room occupancy hotels (SROs), which provide residents with bedrooms but inadequate or no kitchen facilities for food preparation.
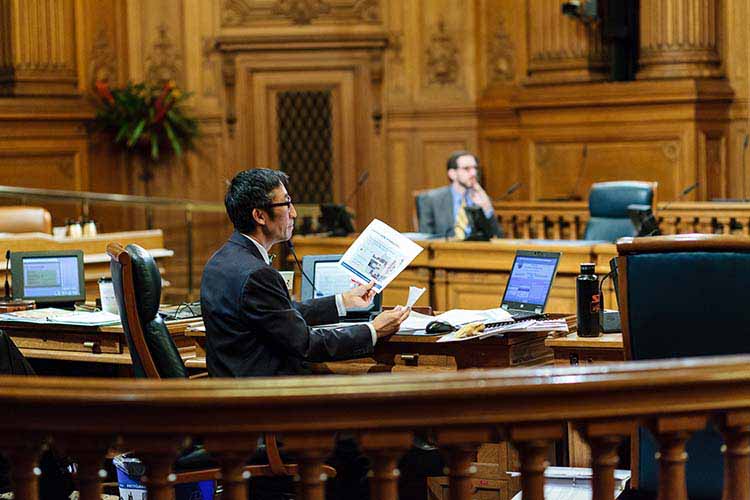
Perhaps most crucially, the resolution built in an obligation for a follow-up hearing at which several city agencies and the Task Force were required to report back to the Board of Supervisors on specific action items. It set the date for several reporting requirements as March 2014.

Turning a resolution into budgetary changes
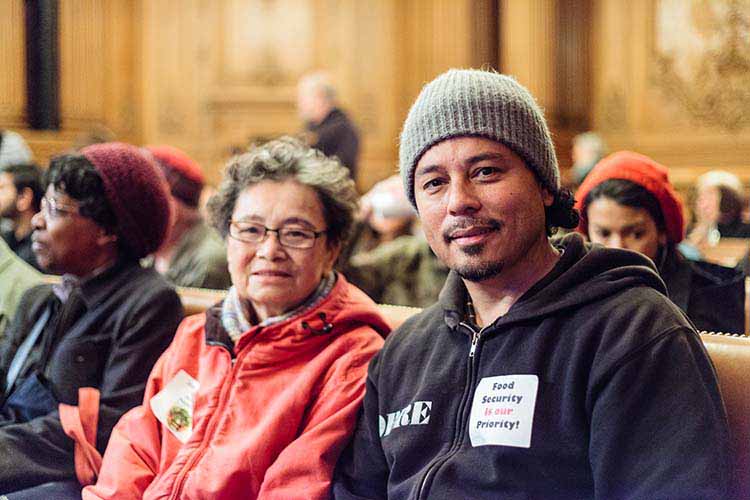
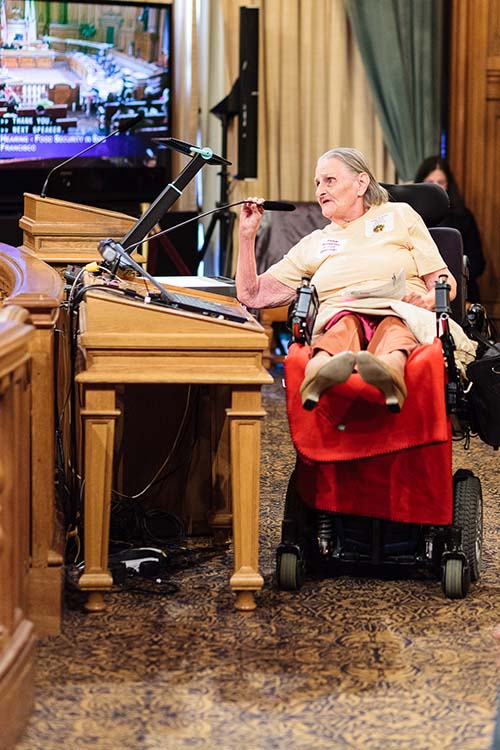
Resolution 447-13 required several agencies to report to the Board of Supervisors in March 2014,16 which meant that food security was already written into the Board’s agenda for that month. The 2014 hearing created agency accountability for making progress toward Resolution 447-13 goals, but it also created a platform for agencies to highlight the importance and impact of their food security programs, along with a space for members of the public to voice their views on the issue. As the Task Force and other public agencies prepared their follow-up reports, it was clear that some of those programs were simply under-resourced. The Task Force provided the Board with information on the agencies’ budget requests and explanations of how those requests would translate to improved food security outcomes.17 Their requests resulted in increased funding for food security programs, starting in FY 2014-2015.
Since that first hearing, the process has become more cyclical. About once a year, the Task Force members report back to the Board on the progress for each obligation listed in Resolution 447-13. Based on the progress under the resolution, the Task Force members create budget requests to address remaining unmet food needs through the city’s various food security programs. They also call for pilot projects to test new policy ideas developed under the resolution.
Passing the resolution created a framework for ongoing reports to the Board of Supervisors and new budget requests when extra capacity is needed, all directed toward the priorities laid out in the resolution. As Quaintance sees it, “building a relationship through this process has allowed us [the Task Force] to ask for funding and be successful in getting funding.” In fact, since the resolution was passed, the cumulative increase in funding for food programs for food insecure people has been $33.7 million.18 The Task Force is able to leverage those increased resources in part because budget requests for food security programs are tied to commitments articulated in the resolution. Since the Task Force laid the groundwork of extensive data collection in the 2013 assessment, they have credible numbers to use in their budget requests. They can show how many people are not being reached by current food security programs and what it would cost to bridge that gap through a particular program. For an example of the Task Force’s approach, see one of their FY 2016-2017 funding request calculations below.
Seniors and Adults with Disabilities
Vision: A community where seniors and adults with disabilities are able to live independently without the risk of poor nutrition or social isolation. By supporting the “nutrition continuum” of congregate meals, home-delivered groceries and home-delivered meals, the city ensures that individuals’ needs are met in the most appropriate and cost-effective way.
| Program | Budget for FY 16-17 (as of April 2016) | Current Service Level | Current and Projected Unmet Need | Cost to Serve Unmet Need | FY 16-17 Budget Request & Rationale |
|---|---|---|---|---|---|
| Home-Delivered Meals (HDM)
Delivery of nutritious meals, a daily safety check and friendly interaction to homebound seniors and adults with disabilities who cannot shop or prepare meals themselves. Many providers offer home assessments, nutrition education and counseling and volunteer programs to prevent isolation and improve health outcomes. DAAS contracts require nonprofit providers to match the DAAS funding with private dollars so DAAS investment is effectively doubled. |
Dept. of Aging and Adult Services (DAAS)
FY 16-17 baseline: $7.74M (= $6.51M for seniors; $1.13M for adults with disabilities). Includes $1.25M increased funding for seniors and $130K for adults with disabilities. |
5,050 individuals (= 4,095 unduplicated seniors and 955 adults with disabilities)
(1,382 unduplicated seniors and unduplicated adults with disabilities were added with FY15-16 increased funding) 4,660 meals daily (7 days/week) to seniors & adults with disabilities. |
Waitlist 319 individuals on current DAAS citywide waitlist as of 3/30/16. Median wait time (as of 2/18/16): 44 days DAAS policy- Maximum wait time for HDM is 30 days and, in an emergency, 2-5 days. Unmet need Total eligible = 10,022 Total served = 5,050 Total unserved = 4,972 4,972 seniors and adults with disabilities are eligible but not receiving HDMs. Total estimated cost = $16 million for total of 3,085,000 meals. |
$1.01 million to serve 319 clients on the waitlist.
$16 million to serve 4,972 individuals (all unmet need). $4 million to serve additional 1,243 individuals. ($3,200 per client, with a total of 771,250 meals delivered.) |
HDM Total $5.01 million With this additional funding, a total of 6,293 clients would be served by HDM by end of FY 16-17. Request includes:
AND: Request includes:
|
| Home-Delivered Groceries
Food pantry-based grocery program. Donated groceries delivered by IHSS caregivers and CBO volunteers to serve homebound seniors and adults with disabilities who are unable to access a food pantry themselves, but can prepare meals at home. Each delivery provides fresh produce, protein items and staples (e.g., grains, cereals, and some providers include additional home visit services. |
Dept. of Aging and Adult Services (DAAS)
FY 16-17 baseline: $785,300 Does not include the $315,200 needed to maintain existing service level, or drops by 12% |
2,831 unduplicated clients
112,960 grocery deliveries per year (average 2,259 grocery deliveries weekly) FY15-16 expansion: 12% increase (= 13,525 weekly groceries to 504 clients) |
7,199 individuals
Waitlist = 1,255 individuals (includes ~500 individuals receiving In-Home Support Services with caregivers that can prepare groceries and those currently on Food Bank’s waitlist) Total need = $10,030 individuals (74% seniors, 26% adults with disabilities). |
$6.9 million to serve total unmet need.
$1.257 million to serve current and waitlisted clients. $1.728 million to expand capacity to serve 1,800 individuals (~25% of unmet need) [Cost range $650-$960 annually per individual] |
HDG Total $2,985,200 Request includes:
|
| Congregate Lunch Meals
Daily, hot, nutritious meals served to individuals over 60 and adults with disabilities at sites throughout the city. Lunch is often at senior centers that offer social activities and other programs, and services for social engagement and promoting healthy lifestyles. |
Dept. of Aging and Adult Services (DAAS)
FY 16-17 baseline: $5,380,633 Need $777,000 to maintain existing, or service drops by 10%. FY15-16 $6,157,633 ($5,842,262 for seniors and $315,371 for adults with disabilities) |
18,844 unduplicated clients (17,968 seniors & 876 adults with disabilities)
(1,152 new clients added in FY 15-16) ~3,632 daily meals (or 944K total meals). Added 6 new sites, including 2 CHAMPS sites, 2 breakfast sites. Total = 50 meal sites throughout the city. |
Based on monthly reports from senior lunch providers, 1,072 individuals were turned away in FY14-15.
Based on DAAS 2016 needs assessment, 25,103 seniors and 11,600 adults with disabilities are at <100% FPL |
$777,000 to maintain current service level.
$2.7 million to increase service by 1,000 individuals (daily meals), = 3% of estimated unmet need. [~$2,630 annually for each individual served daily] |
Congregate Lunch Total $3.48 million Request includes:
|
Forging partnerships and inviting participation
Although the Task Force plays a leading role in San Francisco food security policy, it relies on partnerships and community input to increase its impact. Over the years, the Task Force has forged stronger relationships with legislators and built up its role in the budget-making process. It has also been able to get more money allocated for smart pilot projects through that connection.
Through better communication among agencies working in food and in health, they have also joined some related services together. For example, In Home Support Services (IHSS) workers are now connected with local food pantries so they can pick up groceries and bring them to the home-bound people they are already helping.
Public participation in food security policy happens in a number of ways in San Francisco. One method of ensuring community input is through the membership of the Task Force itself—most of its members are service providers with extensive experience working with food insecure people. But members of the public have also participated directly, including in ongoing Task Force meetings (which are open to the public) and at the public hearing on the 2013 assessment, before the resolution was passed.
Community members have also been heard through community surveys and focus groups. Although finding which programs have budget shortfalls does not necessarily require much stakeholder input, it is important to make sure that the Task Force uses its budget requests for programs that people actually want. So the Task Force builds those inquiries into its ongoing assessments and surveys.
Policy Impact and Next Steps
The resolution’s most concrete impacts have been programmatic improvements to meet the food needs of more San Franciscans who are food insecure. For example, home-delivered meals programs are delivering an additional 3,000 meals per day.19 The resolution’s impacts are also felt through the follow-on work it established for the Task Force. One example is its focus on residents of SROs. The Task Force conducted a survey of SRO residents, assessing food insecurity and including questions about health and medications.20 The results of that survey spurred ongoing work to understand and address the nutritional needs of SRO residents.
Beyond immediate service delivery impacts, the Resolution has had a wider policy impact by shaping the way that San Francisco addresses food insecurity. For one, it explicitly tied food insecurity with health outcomes.21 Second, it set citywide priorities for food security measures. One result of this approach is that it has elevated the profile of food security programs within the agencies that house those programs. That has been helpful in getting needed resources allocated to food security programming without increasing the budgets of the agencies as a whole.
Food Pantries Across San Francisco
One positive unintended consequence of the resolution and its associated cycle of hearings and budget requests is that requests have caught the eye of private foundations. Some of the Task Force’s budget requests have not been fully funded by the City, but were later picked up by private foundations (e.g., some of the Task Force’s SRO work). Private donors know that these proposals are aligned with public investments and priorities, so it is easier to show them the added impact of their donations.
As of late 2017, the Task Force was working on an updated assessment of food insecurity in San Francisco, which is expected to be published in early 2018. In some respects, the next assessment will be about updating numbers to capture changes in the food security landscape over the past five years. But it will also update the Task Force’s policy approach, including by looking at health equity demographically, rather than only by district or neighborhood. The Task Force will be integrating health data from the San Francisco Community Health Assessment, and especially variables that reveal health inequities by geography, age, or race/ethnicity. That new assessment will likely lead to a hearing before the Board of Supervisors, and then to an updated resolution. The new resolution will set priorities for the city’s food security efforts for the next several years as the Task Force and its partners strive to get closer to a food-secure and hunger-free San Francisco.
Lessons Learned
Some key lessons and best-practices were shared by the experts we spoke with for this case study. These lessons include the following:
- Treat data collection as a crucial element of addressing food insecurity. Collecting and analyzing the data for San Francisco’s assessment required a huge commitment of time and relationship-building. But ultimately, that effort created a credible resource to show unmet food security needs throughout the city, which could then be leveraged to increase resources where they were most needed.
- Recognize the importance of building trust. The Resolution and following budget allocations emerged from a long process of individuals and agencies working together, both within the Task Force and in communities they serve. Consensus for decisions was built along the way, and would likely have been much harder to forge if Task Force members had not built their credibility through longstanding relationships.
- Use a resolution or similar policy tool as an opportunity to set priorities and guidelines. Having a shared guidance tool outlining priorities is useful for elected officials, city agencies, and the budget process. It also helps guide the Task Force’s work, to help keep them focused on areas of greatest need. And it helps set up possibilities for public-private partnerships.
- Stay focused on solutions. “I think it’s important that people believe they can end hunger, that we can address it,” said Quaintance. “Even if it’s millions of dollars . . . there is a lot of change that you can make.” Although it takes significant resources and incredible patience to make headway on the problem of food insecurity, progress is always possible. For San Francisco, staying focused on solutions helps ensure that steps are always being taken forward to identify and reach the city’s remaining food-insecure residents.
About the Healthy Food Policy Project (HFPP)
The HFPP identifies and elevates local laws that seek to promote access to healthy food while also contributing to strong local economies, an improved environment, and health equity, with a focus on socially disadvantaged and marginalized groups. HFPP is a multiyear collaboration of the Center for Agriculture and Food Systems at Vermont Law School, the Public Health Law Center, and the Rudd Center for Food Policy & Obesity at the University of Connecticut. This project is funded by the National Agricultural Library, Agricultural Research Service, U.S. Department of Agriculture.
Additional Acknowledgments
The HFPP also thanks its Advisory Committee members for their guidance and feedback throughout the project. Advisory Committee members are: Dr. David Procter with the Rural Grocery Initiative at Kansas State University, Dr. Samina Raja with Growing Food Connections at the University of Buffalo, and Kathryn Lynch Underwood with the Detroit City Planning Commission. Previous advisory committee members include Pakou Hang with the Hmong American Farmers Association and Emily Broad Leib with the Harvard Food Law and Policy Clinic. Renee Gross, JD, served as a project consultant from 2015-2018.
Notes
1 U.S. Department of Housing and Urban Development, The 2016 Annual Homelessness Assessment Report (AHAR) to Congress, November 2016, p17, available at https://www.hudexchange.info/resources/documents/2016-AHAR-Part-1.pdf.
2 U.S. Census Bureau: San Francisco County Population Characteristics, 2012-2016, at https://www.census.gov/quickfacts/fact/table/sanfranciscocountycalifornia/INC110216. Note: San Francisco County and San Francisco City are coterminous. In this case study, the term “city” is generally used. However, census bureau information for San Francisco County is covering the same population and geographic area.
3 San Francisco Food Security Task Force, Assessment of Food Security in San Francisco (2013), 4, https://www.sfdph.org/dph/files/mtgsGrps/FoodSecTaskFrc/docs/FSTF-AssessmentOfFoodSecurityInSF-2013.pdf (2013 Assessment).
4 Id.
5 Id.
6 Id.
7 The percentage of residents age 65 and older was 13.7% in 2010, and is rising. San Francisco Health Improvement Partnership, Community Health Needs Assessment (2016), 14, https://www.sfdph.org/dph/files/hc/HCAgen/HCAgen2016/May%2017/2016CHNA-2.pdf
8 2013 Assessment, 4.
9 Id. at 13.
10 Id. at 5.
11 Id.
12 Id. at 8.
13 Id. at 10.
14 Id. at 13.
15 Resolution 447-13, http://sfbos.org/ftp/uploadedfiles/bdsupvrs/resolutions13/r0447-13.pdf
16 The actual hearing took place April 10, 2014.
17 For example, Food Security Task Force hearing materials for April 2014, “How You Can Help: Approve Budget Requests,” 19, https://www.sfdph.org/dph/files/mtgsGrps/FoodSecTaskFrc/docs/FSTF-Hearing04102014.pdf
18 Interview with Paula Jones, San Francisco Department of Public Health, Oct. 3, 2017.
19 Food Security Task Force, “Hearing Materials: Food Security in San Francisco-Update and Next Steps,” Apr. 11, 2016, 19, https://www.sfdph.org/dph/files/mtgsGrps/FoodSecTaskFrc/docs/HearingMaterials4-13-16.pdf (2016 Hearing Materials).
20 Strategies to Improve Food Security Among “Single” Residents of San Francisco’s SROs, 2016 Hearing Materials, 47-71.
21 Food Security Task Force presentation to Neighborhood Services and Safety Committee, San Francisco Board of Supervisors, “Food Security in San Francisco,” Nov. 21, 2013, slides 6-7, https://www.sfdph.org/dph/files/mtgsGrps/FoodSecTaskFrc/docs/BOS-FoodSecurityHearing11-21-13_RFS.pdf
22 2014 hearing cover letter memo, hearing materials, p1.
Key Demographics Table Notes
1 Source: Vintage 2016 Population Estimates: Population Estimates
2 Source: 2010 U.S. Census Bureau, Quick Facts
3 Source: 2011-2015 American Community Survey 5-Year Profiles
4 Source: 2015 USDA/ERS Food Access Data


